• Skip to primary navigation
  • Skip to main content

SALT.

Search Toggle
  • What is Salt?
  • Principles
  • Seascape Map
  • Story Hub
  • Supply Chain
  • Dive Deeper
  • Search Toggle

Dive Deeper

  • Skip to Topics Filter
  • Skip to Regions Filter
  • Skip to Types Filter
  • Skip to keyword input
  • Skip to Resource Content
Clear Filters
Is your resource missing? Submit Resource
Is Your Resource Missing? Submit Resource
  • Infographic

resourcetrade.earth Seafood Trace Chart Generator

Chatham House
2020
resourcetrade.earth Seafood Trace Chart Generator

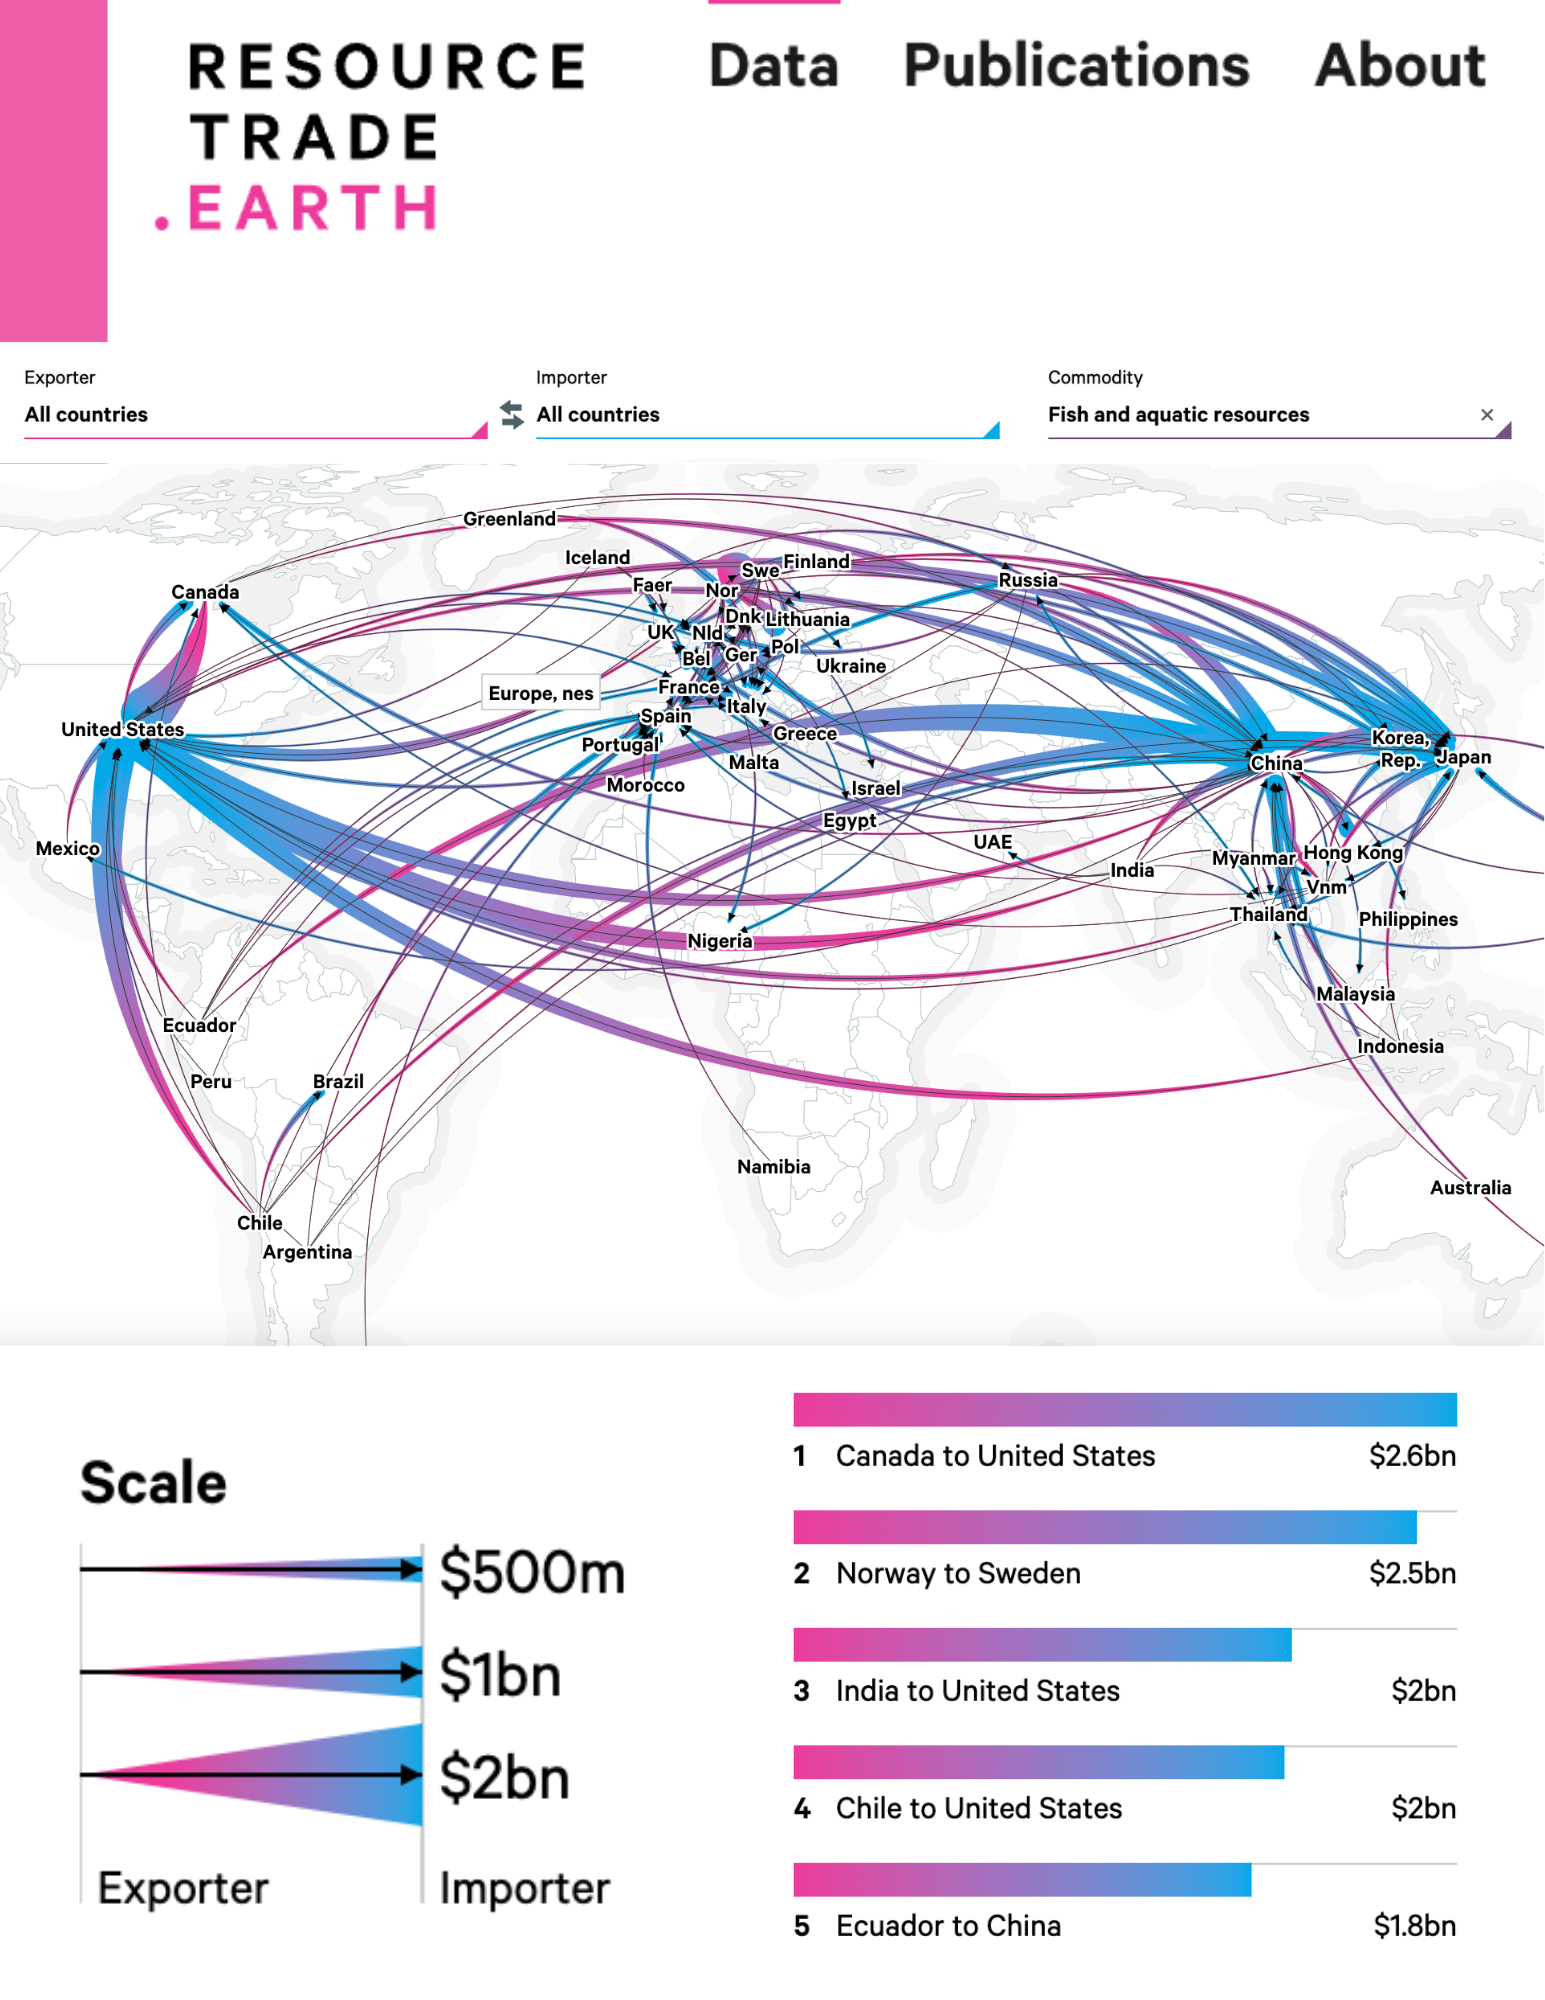
resourcetrade.earth has been developed by Chatham House to enable users to explore the fast-evolving dynamics of international trade in natural resources, the sustainability implications of such trade, and the related interdependencies that emerge between importing and exporting countries and regions. The linked interactive chart and infographic exhibit global seafood trade, breaking data into value and weight traded between nations.

Topic:
  • Seafood Industry
Region:
  • Global
Tags:
Global, Seafood, Trade
VISIT RESOURCE
Share:
RECEIVE UPDATES FROM SALT SIGN UP FOR OUR NEWSLETTER

Footer Logo
  • What is Salt?
  • Principles
  • Seascape Map
  • Story Hub
  • Supply Chain
  • Dive Deeper
  • Linkedin
  • Facebook
  • Twitter
  • Instagram
  • Spotify
  • Youtube
  • Contact Us
  • Terms of Use
  • Privacy Policy

© 2023 SALT

This product is made possible by the generous support of the American people through the United States Agency for International Development (USAID). The contents are the responsibility of FishWise and do not necessarily reflect the views of USAID or the United States Government.